
Drawing and Reading Double Bar Graphs
Drawing and Reading Double Bar Graphs: Overview
This topic covers concepts such as Double Bar Graph for Data Having Two Types and Drawing Double Bar Graphs.
Important Questions on Drawing and Reading Double Bar Graphs
Directions: Study the bar graph provided below gives the sales of books (in thousands numbers) from six branches of a publishing company during two consecutive years and . Answer the questions based on the graph
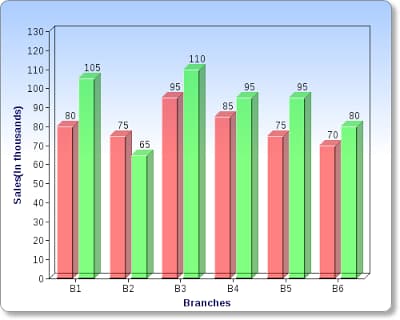
Total sales of branch B6 for both the years is what percent of the total sales of branch B3 for both the years ?
The following numbers of votes were cast at polling booths during the Gram Panchayat elections:
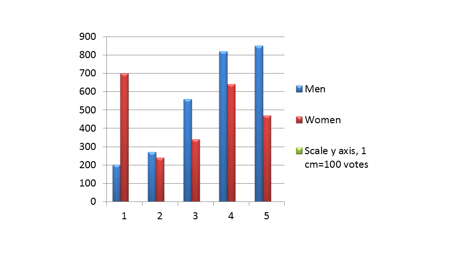
In which booth is the maximum number of votes cast during the Gram Panchayat elections? (Booth / Booth / Booth / Booth / Booth )
The numbers of children vaccinated in one day at the government hospitals in Solapur and Pune are given in the graph:
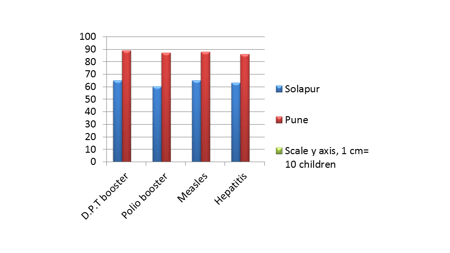
In which city the maximum number of children vaccinated on that day?
The table below graph shows the number of people who had the different juices at a juice bar on a Saturday and a Sunday.
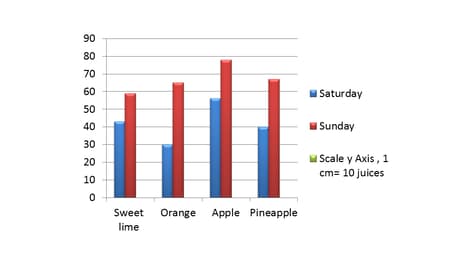
Which day is the number of people maximum in the juice bar?
The number of saplings planted by schools on World Tree Day is given in the graph below.
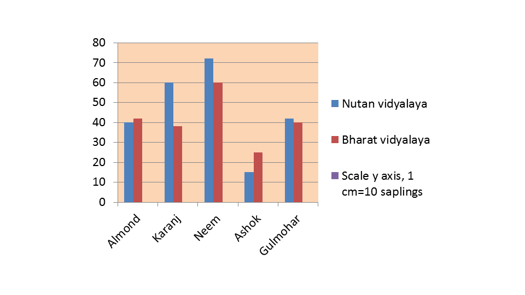
Which plant has the highest number of saplings planted in total?
In a public library, the librarian made the following observations in a particular week.
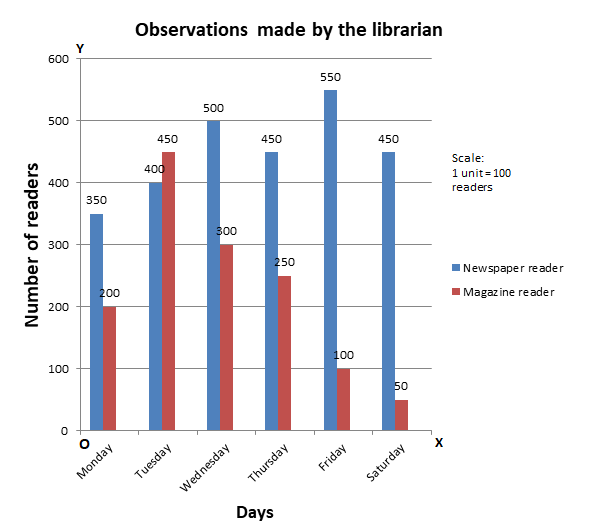
On which day, the number of readers in the library was maximum?
Consider the following data gathered from a survey of a colony:
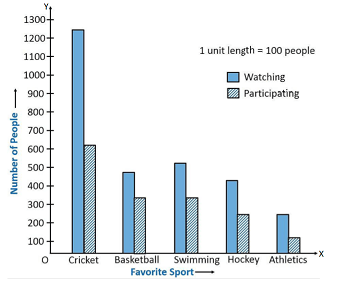
What is more preferred sports to watch?
The following bar graph represents the no. of students attending hobby classes in school during two weeks.
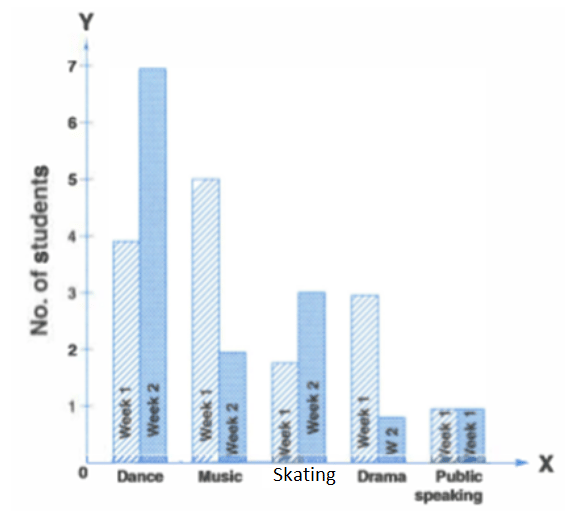
Considering both weeks together which hobby class was attended by more than students? (Dance/ Music/ Skating/ Drama/ Public speaking)
The following bar graph represents the no. of students attending hobby classes in school during two weeks.

Considering both weeks together which hobby class was attended by less than four students? (Dance/ Music/ Skating/ Drama/ Public speaking)
The given double bar graph shows marks obtained by Riya and Siya in their semester examination.
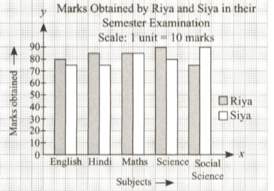
In which subject did Riya and Siya obtain the same marks? (English/ Hindi/ Mathematics/ Science/ Social Science)
The given double bar graph shows marks obtained by Riya and Siya in their semester examination.

In which subject is the difference between the marks of Riya and Siya the maximum?
Sale of English and Hindi books in the years are shown in the below double bar graph:
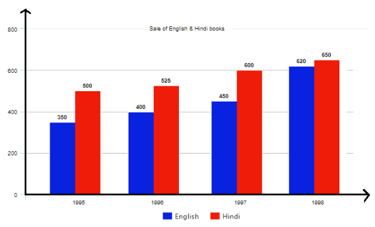
Find the year in which the sale of English books is minimum.
Sale of English and Hindi books in the years are shown in the below double bar graph:
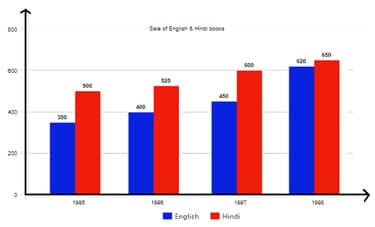
Find the year in which the difference in the sale of the two language books is the least.
The given bar graph shown the result of a survey to test water resistant watches made by different companies. Each of these claimed that their watches were water resistant. After a test, the below results were revealed.

Find the fraction (in the simplest form) of the number of watches that leaked to the number tested for D company.
The given bar graph showing the result of a survey to test water resistant watches made by different companies. Each of these claimed that their watches were water resistant. After a test, the below results were revealed.
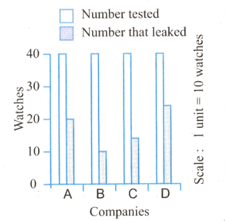
From the given data, find which company has better watches. (Company A/Company B/Company C/Company D)
The yearly production of cotton saris woven by Utpal and Aminabibi from Phulia is shown in the double bar graph.
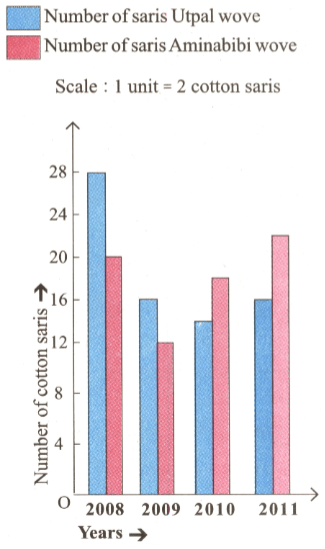
In which year did Utpal weave maximum number of saris?
The yearly production of cotton saris woven by Utpal and Aminabibi from Phulia is shown in the double bar graph.

In which year did Aminabibi weave maximum number of saris than Utpal?
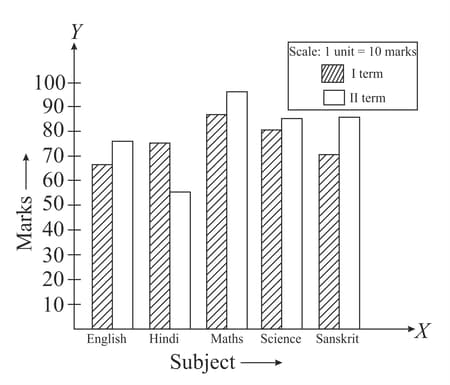
The following dual bar graph represents performance of Prateeksha in term and term. In which subject the highest marks are scored in term ?
The graph that is drawn to compare two quantities having the same units is:


